Learning how to read the stock market is foundational for anyone interested in tracking equity prices, understanding market cycles, or making informed investing decisions. The stock market brings together buyers and sellers of public company shares, using price data, financial ratios, and chart patterns to reflect collective sentiment and fundamental business value.
Who This Is For & Suitability
New investors and students wanting to interpret stock quotes and charts.
Long-term savers and traders seeking analytical skills for market decisions.
Anyone needing clarity on market data, volatility, liquidity, and disclosure basics.
Best suited for those with patience to learn financial terms and develop a disciplined approach.
Key suitability factors: willingness to digest quantitative information, moderate to high risk tolerance, and a time horizon of several years. Short-term traders require additional risk controls and quicker reactions to real-time market signals.
Key Facts (At-a-Glance)
Item
Details
Stock Market
Marketplace for buying/selling shares in public companies.
Stock quotes typically display last trade price, bid, ask, daily volume, market cap, P/E, and % change.
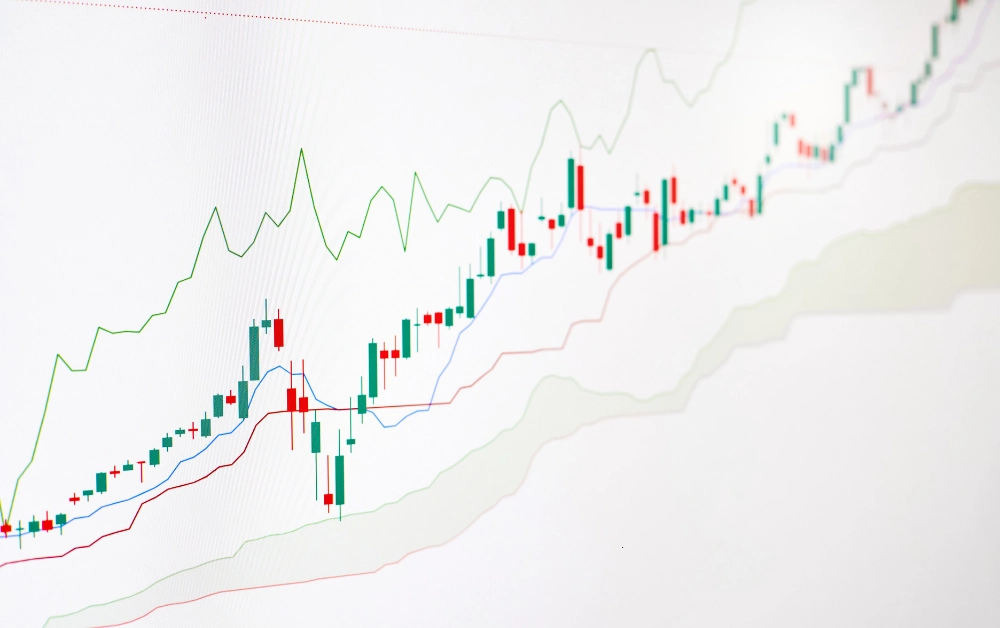
Charts use candlestick or line formats to show price history—each bar represents open, high, low, and close for a given interval.
Volume bars show how many shares traded, signaling conviction or potential reversals.
Indicators like moving averages (SMA/EMA), Relative Strength Index (RSI), or MACD can highlight momentum or trend changes.
How to Interpret Key Ratios & Metrics
Market capitalization: Share price × shares outstanding. Classifies companies as large-cap, mid-cap, or small-cap.
Earnings per share (EPS): Net income divided by shares outstanding; higher values suggest strong profitability.
Price-to-Earnings (P/E) Ratio: Share price divided by EPS; a tool for relative valuation against peers or history. High P/E can imply growth expectations or overvaluation.
Price-to-Book (P/B) Ratio: Stock price relative to book value per share; used for asset-heavy sectors.
Dividend yield: Annual dividend divided by stock price; relevant for income-focused investors.
Beta: Measures stock volatility versus the market; higher beta = greater sensitivity to market swings.
Free cash flow (FCF): Cash produced after operating and capital expenses. Evaluates sustainability of dividends/buybacks.
Comparisons to industry averages and sector trends help contextualize any single company figure.
Markup: Broad optimism emerges, increasing prices and volume; new bull market.
Distribution: Sentiment peaks, insiders or institutional players begin selling; price growth slows or stalls.
Markdown: Pessimism spreads, selling accelerates; prices drop towards new lows.
Cyclical recognition is vital to avoid buying at peaks or panic-selling at lows.
How Exchanges & Orders Work
Major exchanges (NYSE, Nasdaq) host matching engines in which buyers (bids) and sellers (asks) meet.
Order types:
Market order: Immediate execution at best available price; risk of slippage in volatile stocks.
Limit order: Set your maximum buy/minimum sell price; ensures control but not guaranteed fill.
Stop/stop-limit order: Becomes active only if the price crosses a predefined threshold; helps manage risk.
Bid-ask spread: The gap between highest buying and lowest selling price; tighter spreads suggest better liquidity.
After-hours trading extends beyond standard sessions but usually has lower liquidity and wider spreads; volatility can spike on earnings news or macro events.
Halts and circuit breakers temporarily pause trading during extreme volatility to allow orderly price discovery.
Corporate Actions & Ownership Rights
Dividends: Cash or stock payments to shareholders, often quarterly; checked via ex-dividend and record dates.
Stock splits and reverse splits: Adjust share count and price, impacting liquidity but not intrinsic value.
Rights issues and buybacks:
Rights—opportunity to buy new shares at a discount (potential dilution).
Buybacks—companies repurchase their own stock, often boosting EPS and stock price.
Ownership rights may include voting at annual meetings (varies by class), eligibility for dividends, and receipt of company disclosures.
Key dates: Ex-dividend (must own shares before this to receive next dividend), record date (broker registers shareholders), payable date (dividend paid).
Costs, Taxes & Disclosures
Commissions: Many U.S. brokers offer zero-commission trading for standard U.S. stocks, but check for exceptions (e.g., penny stocks, foreign shares).
Bid-ask spread: Implicit trading cost—wider in illiquid or volatile stocks.
Regulatory fees: Small SEC and TAF charges may apply per share; “sample/illustrative” is a few cents per $10,000 traded. For current rates, review the official SEC homepage.
Taxes:
Dividends: Qualified dividends may be taxed at preferential rates; ordinary dividends at normal income tax rates. The IRS official tax guidance covers specifics.
Capital gains: Short-term gains (held ≤1 year) taxed at ordinary rates; long-term gains (held >1 year) at potentially lower rates.
Wash sale rule: Selling at a loss and repurchasing the same (or substantially identical) security within 30 days disallows capital loss deduction.
Disclosures:
U.S. public companies must file quarterly/annual reports (10-Q, 10-K) and material event disclosures (8-K) via SEC EDGAR (official filings).
Return on equity (ROE) and return on invested capital (ROIC): Gauge how well capital creates returns versus peers.
Valuation: Compare ratios (P/E, P/B, EV/EBITDA) to sector averages and growth prospects.
Scenario analysis: Consider best and worst-case outcomes; how could results change if key assumptions shift?
Liquidity/free float: Are enough shares held by the public for easy trading?
Volatility/beta: How much does the stock move relative to the broader market?
Costs & Taxes Table
Cost/Tax Component
What It Covers
How It’s Experienced
Commissions
Broker trade execution
Per trade (often $0 in U.S. for most stocks; exceptions may apply)
Bid-Ask Spread
Liquidity/volatility cost
Implicit in executed price—wider for illiquid securities
SEC/TAF Fees
Regulatory transaction costs
Small fees per share or dollar volume (check SEC homepage for updates)
Capital Gains Tax
IRS tax on gains
Applies on sale for taxable accounts; long vs short-term rates
Dividend Tax
IRS tax on payouts
Qualified or ordinary—rate depends on holding period/type
How to Evaluate a Stock: Checklist
Assess business moat, addressable market, and competitive advantage.
Review financial statements for FCF, sales/EPS growth, margins, debt (leverage), and return metrics (ROE/ROIC).
Identify growth drivers, external risks, and reasonable scenarios.
Compare valuation multiples (P/E, P/B, EV/EBITDA) to sector/peers.
Scrutinize management quality, past actions, and dilution policy (stock-based compensation, buybacks).
Check liquidity (free float, average daily volume), trading volatility and beta, sector and portfolio diversification.
Frequently Asked Questions
What is the best source for official company data?
The SEC’s EDGAR system provides all mandatory U.S. public company filings.
How is the P/E ratio used in stock analysis?
It compares a company’s stock price to its per-share earnings, allowing relative valuation against industry peers or market average.
What does “beta” tell me about a stock?
Beta measures the volatility of a stock relative to the overall market; a beta over 1 indicates above-average volatility.
How are dividends taxed in the U.S.?
Qualified dividends may receive preferential rates if the stock is held for a specified time; ordinary dividends are taxed at the same rate as other income.
What’s the typical settlement timeline in the U.S.?
U.S. stocks use a T+1 settlement cycle, meaning trades settle one business day after execution.
Are all stocks equally liquid?
No. Large-cap stocks generally have higher liquidity and tighter spreads, while small-cap and microcap stocks can have much wider bid-ask spreads and lower volume.
Where can I learn about regulatory changes?
Monitor updates through official websites like the SEC, FINRA, and IRS for tax guidance.
Conclusion & Next Steps
Understanding the stock market requires a systematic approach to reading data, ratios, and cycles, as well as grasping risks, costs, and regulatory requirements.
Begin developing these skills by regularly tracking quotes, learning to read financial statements, and referencing official sources such as the SEC Investor Education homepage.
Stay informed about updates in settlement, tax policy, and trading rules, especially as these may change annually or differ by country.
For additional foundational learning, refer to official educational content at NYSE and Nasdaq.